
Tables
Overview
The Table Bar provides tools for viewing, customising, and exporting demographic data tables. You can adjust how numbers are displayed, copy data directly to spreadsheets, and download tables in various formats including Excel, CSV, JSON, and PNG images.
Where to find it: Look for the Table button above any data table. Click it to expand and reveal the table along with its controls.
Expanding and Collapsing Tables
Click the Table button to expand or collapse the data table. The button shows a plus icon when collapsed and a minus icon when expanded.

Table bar collapsed

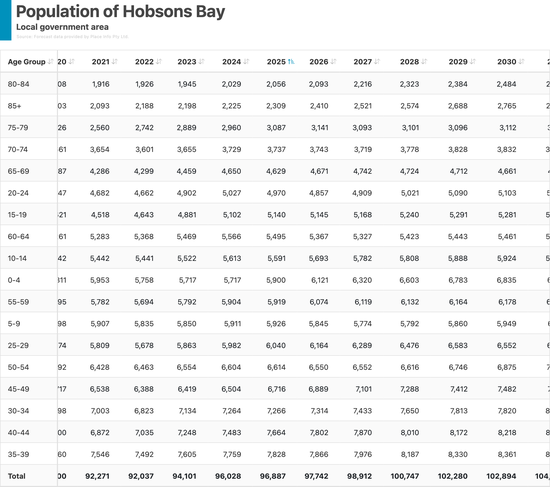
Table bar expanded with all controls visible
Expanded View
When expanded, you can see the full data table along with controls for copying, downloading, and adjusting settings.
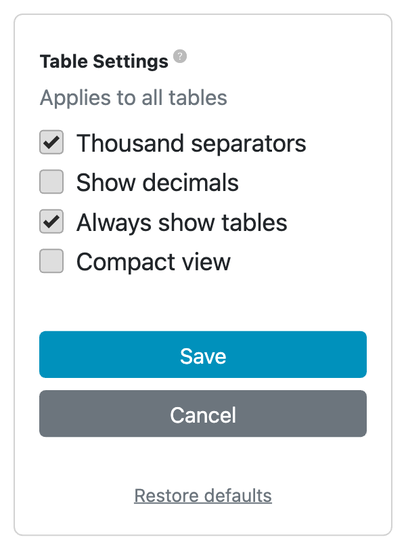
Table Settings
Click the gear icon to open the settings dropdown. These settings apply to all tables across the forecast and are saved in your browser.
Thousand separators — Formats numbers with commas (e.g., 1,234 instead of 1234). Enabled by default.
Show decimals — Displays decimal places in the data. Useful when precision matters.
Always show tables — Tables automatically expand when you load the page, rather than starting collapsed.
Compact view — Reduces padding and font size so more data fits on screen. Useful for tables with many rows or columns.
After changing settings, click Save to apply them. Click Cancel to discard changes, or Restore defaults to reset all settings.
Settings dropdown with display options
Copying Data
Click the clipboard icon to copy the entire table to your clipboard. The copied data pastes directly into Excel or Google Sheets with columns properly aligned.
You can also select specific cells or rows in the table and copy them using your keyboard (Ctrl+C or Cmd+C).
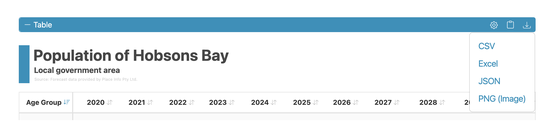
Downloading Data
Click the download icon to see the available export formats:
CSV — Comma-separated values file. Opens in any spreadsheet application or text editor.
Excel — Native Excel format (.xlsx). Preserves formatting and is ready for immediate use.
JSON — Structured data format for use in other applications or scripts.
PNG — Image file of the table including its header. Perfect for presentations or reports where you need a visual snapshot.
Download dropdown showing format options
Column being sorted with indicator arrow
Sorting Tables
Click any column header to sort the table by that column. Click again to reverse the sort order.
- An up arrow indicates ascending order (smallest to largest)
- A down arrow indicates descending order (largest to smallest)
- The "Total" row always stays at the bottom regardless of sort order
Cross-Highlighting
Hover over any data cell to highlight its entire row and column. This helps you track which age group and year you're looking at in large tables.
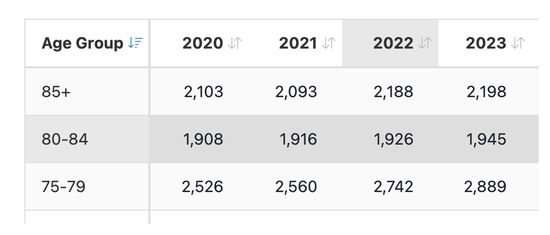
Highlighting age group 80-84 and year 2022
Example: Export population table to Excel
- Expand the table by clicking the Table button
- Click the download icon
- Select Excel
- The file downloads automatically with a descriptive filename including the area name and date
Use this when you need to include the data in a Word document, perform additional calculations, or share raw data with colleagues.
Example: Create a PNG image for a presentation
- Expand the table by clicking the Table button
- Click the download icon
- Select PNG
- The image downloads with the table header included
The PNG captures the table exactly as it appears, including the title bar with area name and source information. Insert it directly into PowerPoint or other presentation software.
Example PNG download result
Example: Sort by year to find peak values
- Expand the table
- Click a year column header to sort by that year
- The highest or lowest values appear at the top (depending on sort direction)
Use this to quickly identify which age groups have the largest populations in a particular year.
Example: Use compact view for more data
- Click the gear icon to open settings
- Tick Compact view
- Click Save
The table displays with smaller fonts and reduced spacing, fitting more rows on screen without scrolling.
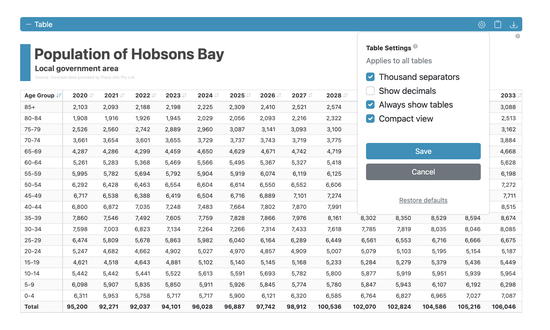
Table with compact view enabled showing more data
Example: Copy specific rows
- Expand the table
- Click and drag to select the rows you need
- Press Ctrl+C (Windows) or Cmd+C (Mac) to copy
- Paste into your document or spreadsheet
This is useful when you only need a subset of the data rather than the entire table.