
Filters
Overview
Filters let you slice forecast data to focus on what matters. Depending on the page, you can filter by sex, age, and year (population pages), by occupancy, privacy, structure, and year (dwellings pages), and by privacy and structure (housing pages). On comparison pages, you can additionally filter by small area to narrow the comparison to a subset of the forecast.
Where to find it: Look for the Filter button on any page displaying forecast data — Population, Births, Deaths, Migration, Dwellings, Housing, and their comparison pages.
Opening the Filter
Click the Filter button to open the filter dropdown. When filters are active, the button displays what's currently filtered (e.g., "Filter: Female, 0-19").

Filter button in default state
Filtering by Sex
Available on population pages (Population, Births, Deaths, Migration).
The sex filter offers three options:
- All (default) — Shows combined data for all sexes
- Male — Shows only male data
- Female — Shows only female data
Select the radio button for your choice.
Filtering by Age
Available on population pages (Population, Births, Deaths, Migration).
The age filter provides three modes:
All (default) — Shows data for all ages combined.
5-year age groups — Select age groups in 5-year bands (0–4, 5–9, 10–14, etc.). Use the quick-select buttons:
- All — Select all age groups
- None — Clear all selections
Click individual age group buttons to toggle them on or off. Selected groups appear highlighted.
Specific ages — Select individual years of age. See the next section for details.
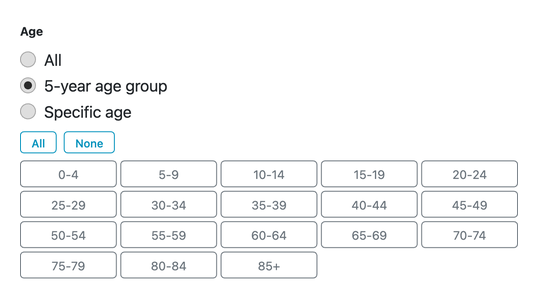
5-year age group selection
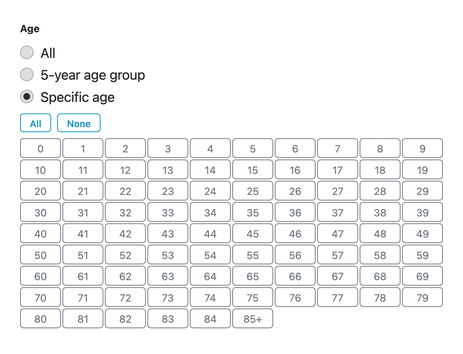
Specific age selection
Specific Ages
Select individual years of age (0, 1, 2, 3, etc.). Use the quick-select buttons:
- All - Select all ages
- None - Clear all selections
Total Aggregation
Whenever a filter narrows the data to a subset, the Total row in the table and chart shows the sum for only your selected items — not the full dataset.
This applies across all filter types:
- Select specific ages: Total shows only those age groups (e.g., select ages 5–17 → Total shows the school-age population only)
- Select Private dwellings: Total shows only private dwellings
- Select Occupied: Total shows only occupied dwellings
This gives you instant cohort or category totals without manual calculations.
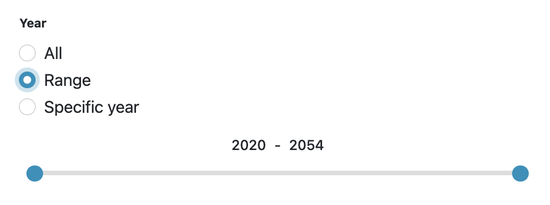
Year range slider
Filtering by Year
Available on all pages.
The year filter provides three modes:
All (default) — Shows data for all available years.
Range — Use the dual slider to select a continuous range of years. Drag the left handle to set the start year and the right handle to set the end year.
Specific year — Select individual years. See the next section for the available quick-select buttons.
Specific Years
Select individual years. Use the quick-select buttons:
- All - Select all years
- None - Clear all selections
- Every 5 - Select years at 5-year intervals (2021, 2026, 2031, etc.)
- Every 10 - Select years at 10-year intervals (2021, 2031, 2041, etc.)
- Estimated - Select years up to and including the jump-off year (historical data)
- Projected - Select years after the jump-off year (forecast data)
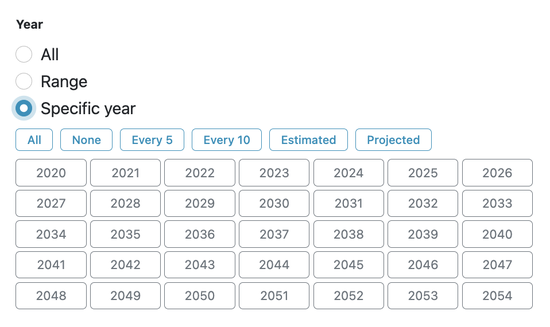
Specific year with quick-select buttons
Keeping Filters Across Pages
Tick the Keep filters across pages checkbox before applying to maintain your filter selections as you navigate between pages. This is also called the sticky filter. It saves time when analysing the same slice across multiple reports.
The sticky filter works within a domain but not across domains. For example, a population filter (Female, 0–19) stays active as you move between Population, Births, Deaths, and Migration pages — but it does not carry over when you navigate to a Dwellings or Housing page, where a separate sticky filter applies.
Applying and Resetting
- Click Apply to apply your filter selections
- Click Reset to clear all filters and return to the default view (All)
When filters are active, the Filter button displays a summary of what's being filtered.

Filter button showing active filter label
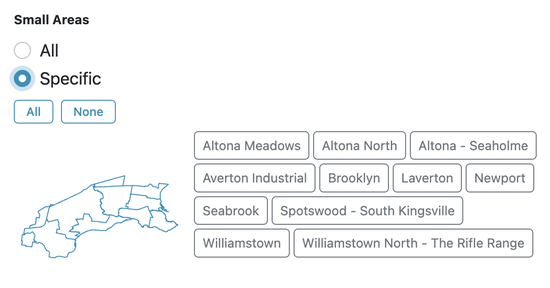
Small Areas section — "Specific" selected with interactive map and area buttons
Filtering by Small Area
The Small Areas section appears in the filter panel on all comparison pages, regardless of domain — Population, Births, Deaths, Migration, Dwellings, and Housing. It lets you restrict the charts to a subset of the small areas in the forecast.
Choose All to include every small area, or Specific to pick a subset. When Specific is selected:
- An interactive map appears — click any area to toggle it on or off, with the map and button grid staying in sync.
- A button grid lists all areas — click individual buttons to toggle them, or use All / None for bulk selection.
When "Keep filters across pages" is enabled, your Small Areas selection persists as you navigate between comparison pages.
Dwelling Filter
Dwellings pages have their own filter panel with four dimensions: Occupancy, Privacy, Structure, and Year. Click the Filter button on any Dwellings page to open it.
The dwelling filter works independently of the population filter and its settings are saved separately when "Keep filters across pages" is enabled.
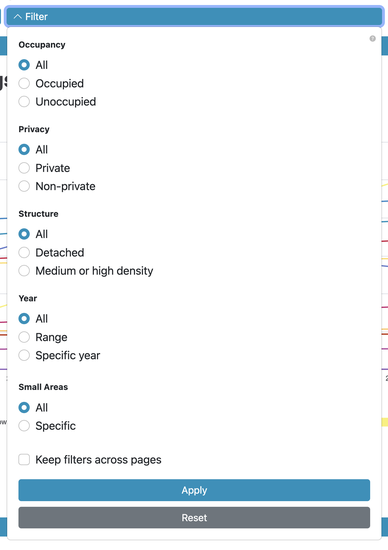
Dwelling filter panel — Occupancy, Privacy, Structure, Year, and Small Areas sections
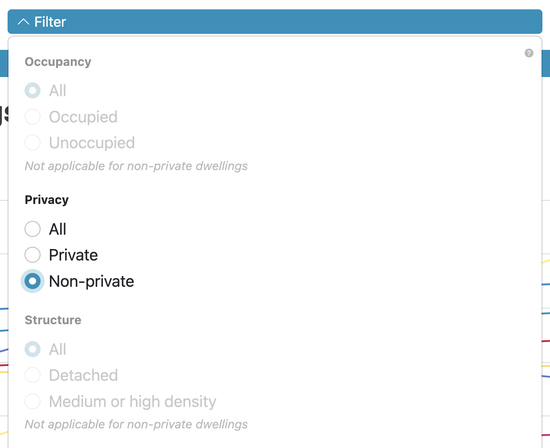
"Not applicable for non-private dwellings" — Occupancy and Structure locked when Non-private is selected
Incompatible Filter Settings
Some filter selections make other options inapplicable. When that happens, the affected options are shown in grey and locked to All, with a note explaining why.
For example, selecting Non-private under Privacy locks Occupancy and Structure to All, because those dimensions are not applicable to non-private dwellings.
When you change your selection so the conflict no longer applies, the locked options become available again.
Housing Filter
Housing pages (Average Household Size, Resident Population in Dwellings, etc.) show a filter panel with two dimensions: Privacy and Structure.
Occupancy is not included because housing metrics always apply to occupied dwellings. The Privacy and Structure options, the non-private override behaviour, and the Small Areas section all work in the same way as the dwelling filter.
Example: View only female population aged 0-19
- Open the filter
- Select Female under Sex
- Select 5-year age group under Age
- Click the None button to clear all groups
- Click 0-4, 5-9, 10-14, and 15-19 to select them
- Click Apply
This is useful for analysing school-age and early childhood populations for service planning.
Example: Compare 5-year intervals for long-term trends
- Open the filter
- Select Specific year under Year
- Click Every 5 to select years at 5-year intervals
- Click Apply
This reduces the number of columns in your table, making it easier to spot long-term trends without the clutter of annual data.
Example: View historical data only
- Open the filter
- Select Specific year under Year
- Click Estimated to select all years up to the jump-off year
- Click Apply
Use this when you need to focus on what has actually been measured rather than projected values.
Example: Focus on working-age population (15-64)
- Open the filter
- Select 5-year age group under Age
- Click None to clear all selections
- Click the groups from 15-19 through to 60-64
- Click Apply
This is useful for workforce planning and economic development analysis.
Example: Maintain filters while comparing reports
- Open the filter and set your desired sex, age, and year selections
- Tick Keep filters across pages
- Click Apply
- Navigate to other pages (e.g., from Population to Births to Deaths)
Your filter settings persist, allowing you to compare the same demographic slice across different reports.
Example: Exclude a small area that distorts the comparison
Some small areas have very small populations that compress the scale of a comparison chart, making other areas harder to read. Averton Industrial, for example, has almost no residential population — including it shifts the axis and crowds out meaningful differences between the remaining areas.
- Open the filter on a comparison page
- Under Small Areas, select Specific
- Click All to start with all areas selected, then click Averton Industrial to deselect it
- Click Apply
The charts now show all areas except Averton Industrial, giving the remaining areas more room on the scale.
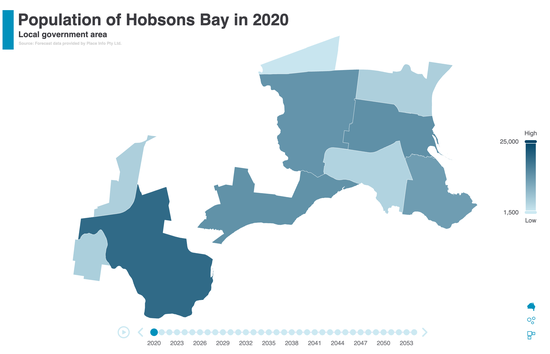
Choropleth showing all areas except Averton Industrial — scale now reflects residential areas only
Choropleth filtered to Altona North and Newport only
Example: Focus on a few areas of interest
When you want to compare just a handful of areas rather than all small areas at once, use the Small Areas filter to narrow the comparison.
- Open the filter on a comparison page
- Under Small Areas, select Specific
- Click None to clear all selections
- Click Altona North and Newport to select them
- Click Apply
The charts now show only those two areas, making it easy to compare their trends directly.
Important Notes
- You cannot mix age groups with specific ages. Choose one mode or the other.
- When sticky filters are active, you'll see a reminder after 10 minutes.
- Filters affect both the data table and any charts on the page.